
 UX Method

Redesigning Podcast Analytics at Acast
Redesigned navigation and episode comparison after research with podcast creators. Mobile share of traffic rose from 21% to 42%.
Context
At Acast I designed the creator tools and the mobile listening app.
While interviewing creators about publishing, I kept hearing problems with Insights, the analytics product that shows them what's resonating and how they're earning.
It hadn't been touched in a while, so I proposed researching its current state.
Internal research
I began internally, interviewing stakeholders and running cross-team workshops to pull together what we already knew: support tickets, technical constraints, open ideas.
I read the Google Analytics data for actual behavior and benchmarked competing analytics tools.
User research
With no prior research on the platform, I recruited six creators from varied backgrounds and interviewed them about how they actually use Insights.
To bring the team along, I had them listen in live and shared empathy maps and recordings in Slack.
Cross-analyzing the interviews surfaced clear behavioral patterns, which I modeled into three personas.
Prioritization
With the personas, problems and constraints shared, I ran effort/impact workshops to prioritize together. We picked three quick wins to ship first and parked a few longer bets for later.
I then ran an ideation workshop on the quick wins. The problems we tackled first:
- Lack of mobile responsiveness
- Unclear site navigation
- Table graph component is confusing
1. How might we improve mobile responsiveness?
Mobile was 21% of traffic, yet the platform didn't adapt to it.
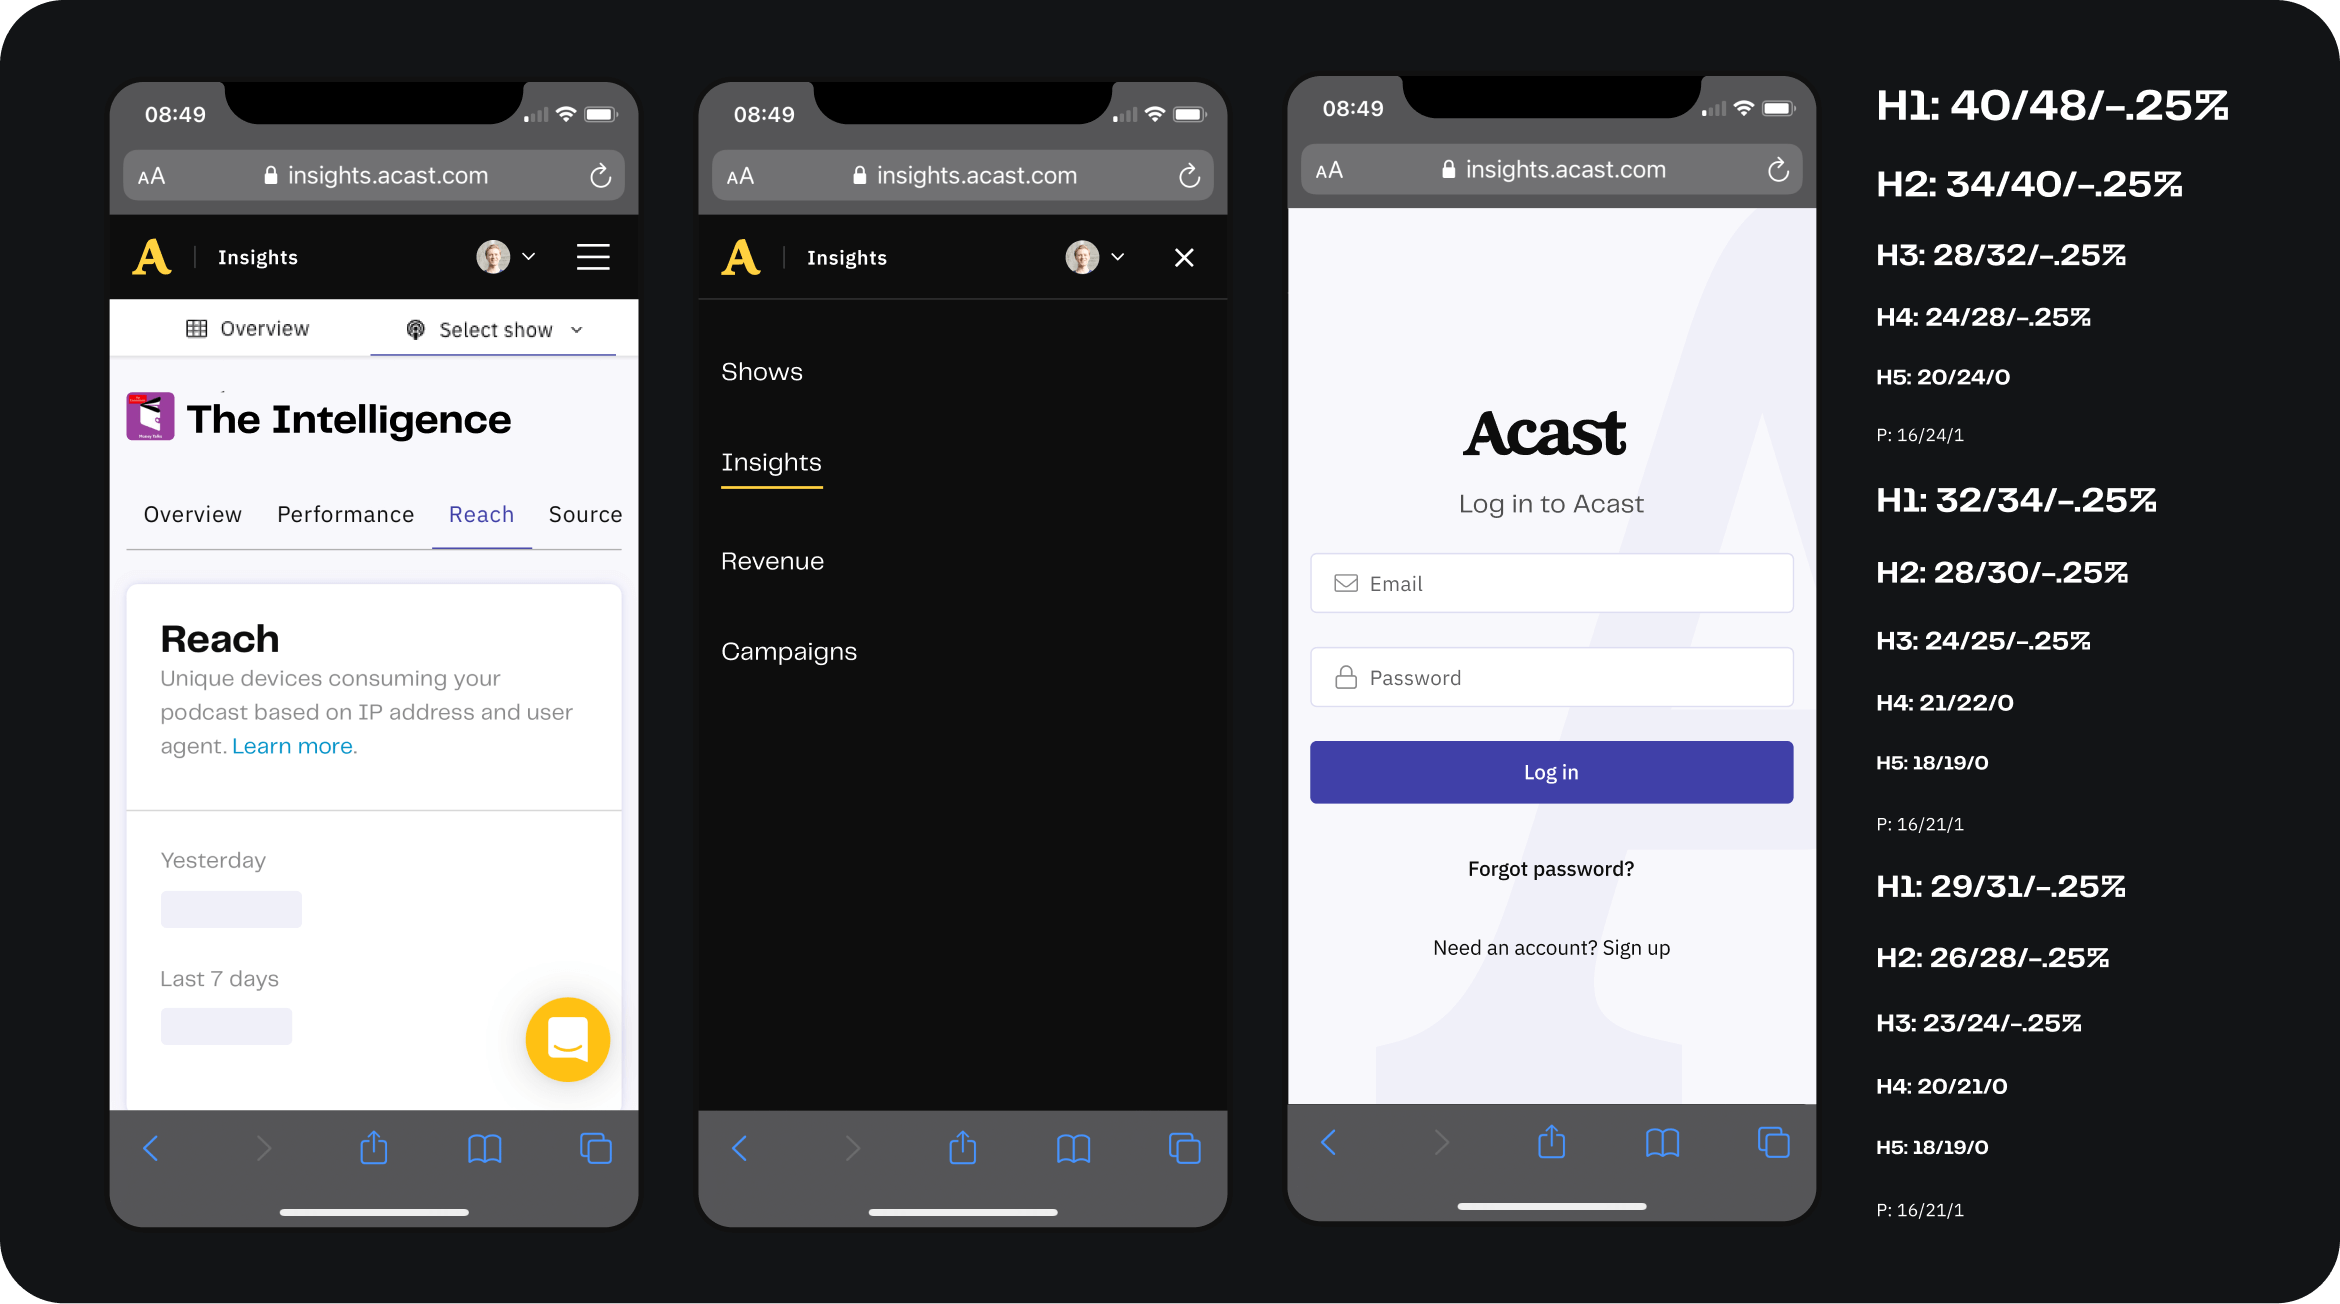
The menu and pagination wouldn't shrink, the login page stayed zoomed out, and padding and type never scaled, so people had to pinch and scroll sideways to read.
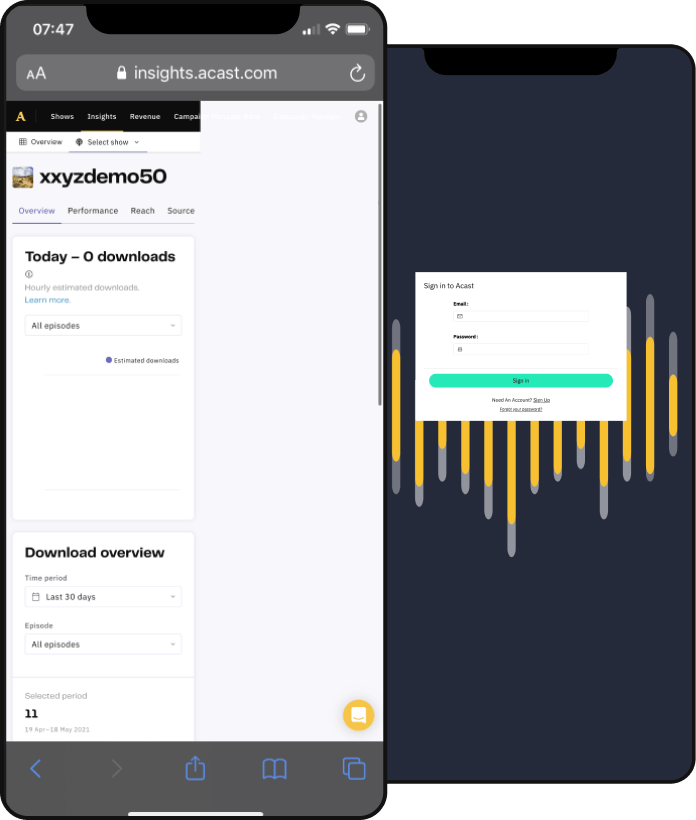
I wireframed fixes for the menu first, reviewed directions with the design team, then detailed the designs and prototyped them for usability testing.
2. How might we increase feature findability?
Creators wanted to track episode performance over time, and some were exporting to their own Excel files, yet most never found the comparison feature already in the product.
It sat last in a long submenu under an unclear name, drawing just 1.8% of visits. My hypothesis: a clearer name and a higher position would fix discoverability.
I renamed 'Compare' to 'Performance', moved it to the second slot, and folded behavior and demographics into a single 'Audience' tab to shorten the menu.
3. How might we improve table graph usability?
The comparison ran on a table-graph component used all over the platform, so fixing it paid off broadly. People struggled to understand how to use it.
They couldn't find the dropdown to add items, and each one had to be added by hand from a long list.
I redesigned it to show every episode up front with a sensible default already plotted, so people could scan and sort to decide what to compare.
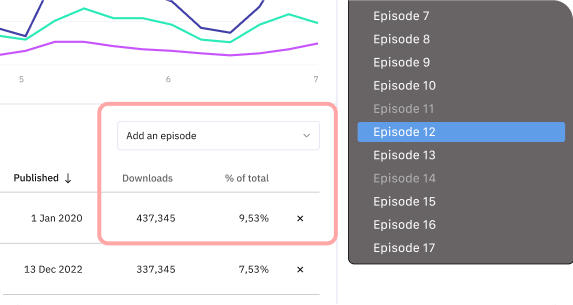
I added search for large catalogs and a column showing each episode against the median, a one-glance read of what's over- or under-performing, which also drove the default selection.
Usability testing
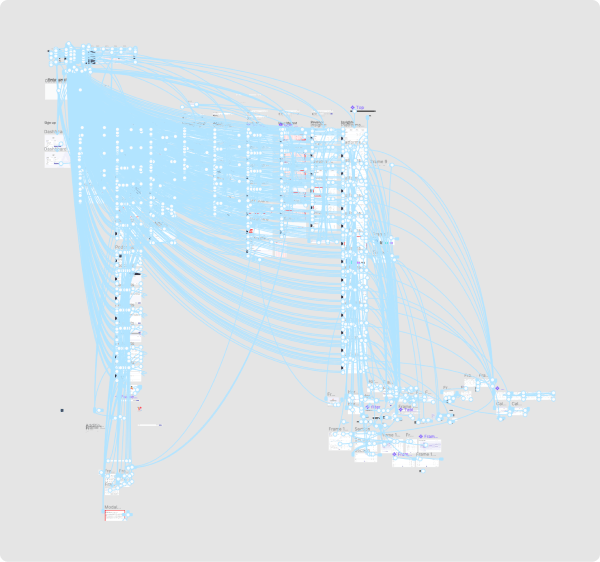
I built desktop and mobile prototypes in Figma, reusing interactions and assets from earlier prototypes for realism.
I then ran five usability tests with creators and adjusted the designs from what I saw.
Implementation
I collaborated closely with the developer throughout implementation, adjusting designs along the way for technical constraints and effort. He was familiar with Figma at this point and could easily inspect my pages, and we often had brief syncs.

Results & Impact
+21pp
Mobile share of traffic
-15pp
Tab bounce rate
+3.4pp
Performance-tab share
Each change moved its metric, and creators could read their audience data more easily.
- After the responsive changes, mobile share of traffic rose from 21% to 42% (+21 percentage points).
- Usability improvements to the compare table graph reduced the tab bounce rate from 41% to 26% (-15 percentage points).
- Renaming the compare tab to Performance and moving it to the second position increased its share of page visits from 1.8% to 5.2% (+3.4 percentage points).

Endorsement
“You don't need to look past Oscar to find a skilled, thoughtful, ambitious, and humble designer. I recommend him without hesitation.”